xyplot
produce x-y plot for binary or ASCII data
Usage
xyplot [options] [file]
Description
xyplot is a program which is practically useful and at the same time a good example for the use of the simplot routines. The source can be a convenient starting point for your own applications. xyplot reads a file (or standard input by default) containing coordinates of datapoints and perhaps markers for those points, and plots it. Data must be sorted on x, or part of the data may be lost on expansion. This is because xyplot otherwise would not be able to efficiently handle expansion of large amounts of data. The file may either be an ascii file with 1 to 3 columns, or it may be a binary file. Ascii files may have comment lines starting with # and comments (not necessarily starting with a #) may be added after the two numbers on a line. Without one of the options -w, -o or -n, an ascii input file is assumed, and xyplot reads the columns that are plotted in an x-y frame. The number of columns in an ASCII file depends on the options -1 and -m:- (no options)
- two columns, with x and y values; a third column, with markers, may be present, but will not be used.
- -1
- one column, with y-values; the corresponding x-values are assumed to be 0, 1, 2, ... etcetera.
- -m
- three columns: x-value, y-value, and a marker which is plotted instead of a dot.
- -1 -m
- two columns: y-value and a marker.
X 1 0 0then a marker testX will be plotted as test in red. A marker X will generate a red dot.
Options
Options -w, -o and -n cause the input file to be considered a binary file. In that case binary words are read and each word is considered a y-value. The corresponding x-value is set to the next available integer, starting at 0. Thus the first y-value will have x=0. Numbers quoting datalength or offset may contain a trailing k,K,M,or m, which multiplies the number with 1024 or 1024x1024. Especially useful for offsets is a trailing w, setting the offset count in units of a word, or a trailing D, setting the offset count in units of displayed datalength.| -s | sets stick mode (see Section Keystrokes) |
| -c | sets connect mode (see Section Keystrokes) |
| -g | sets grid on |
| -w wordlength | sets the length of the word to be read in bytes; default: 4 bytes |
| -o offset | sets the number of bytes to be skipped at the start of the file |
| -n datalength | sets the length of the data in words. Used to cut off the end of the file |
| -x xtext | sets the string plotted along the x-axis |
| -y ytext | sets the string plotted along the y-axis |
| -t text | sets the string plotted in the lower left corner; default: the filename |
| -1 | (default for binary data): the datafile contains only y-data, x's are set to 0,1,2,3,... |
| -m | the dataset has an extra column containing a marker of up to 7 characters. These markers are used instead of bullets to mark the datapoints, as described before. |
| -X Xsize | sets the axes lengths (both x an y) in mm; default: 120 |
| -Y Ysize | sets the y-axis length (only y) in mm; default: same as x-axis length. |
| -D dotsize | sets the dot size in mm; default: 1 |
| -d degree | sets the polynomial degree; default: no polynomial |
| -H symbol height | sets the symbol height; default 3, minimum .8, maximum 8 |
| -l count | makes for count digits left of the y-axis; useful if you generate several pictures and them to be all the same width. |
| -b | no X display presented, PDF plot generated |
| -B | no X display presented, PDF plot generated and sent to the plotter |
Keystrokes
Several keystrokes are available that influence the display interactively. Some of these make use of a number (the current number) that has been typed before hitting the key:| F1 | Help. Shows the available keystrokes. Pressing F1 again returns the xy display. |
| c | Toggle connection lines between points. Initially, points are shown without interconnecting lines. |
| d | Set polynomial degree to current number. Initially, no polynomial is shown. Typing a number (including 0), followed by d, shows the best fit polynomial of degree number through the points. A space, instead of a number, can be used to clear drawing a polynomial. The r-key may be used to show the residuals of the polynomial fit. This may be useful when looking for a good polynomial representation for a set of datapoints. |
| D | Set dot size. Initially points are shown as 1 mm dots. This may be changed with the D key, preceded by a number. A zero number or no number at all removes the dots. |
| e | Toggle plotting of even points only. |
| f | Fourier transform the data or (if current number is non-zero) transform them back |
| g | Toggle grid-plotting. |
| I | differentiate. |
| i | integrate. |
| l | toggle labeling. |
| m | Print the pointer's current x and y to stdout. |
| M | Print all x and y to stdout. |
| o | Toggle plotting of odd points only. |
| O | Output differences datafile. The y-differences of the datapoints are written to a file with the same name as the input file (or xyplot, if input was from standard input) with a .txt extension. This is of course only useful for equidistant data. |
| p | Plot to a PDF file. |
| P: | Plot to the plotter (an appropriate PDF conversion filter is assumed to be installed). |
| q | Quit |
| r | Toggle residual plotting. The differences between the y-values of the datapoints and the y-values for the current polynomial are shown instead of the datapoints themselves. Pressing r again returns to the datapoint display. |
| s | Toggle stick mode. In stick mode, datapoints are shown as sticks at position x with height y. This mode is especially useful for the detection of clustering in large amounts of data. The option m may be useful to output the x-values separating the clusters to standard output. |
| S | smooth, using current number as smoothing range. |
| w | Write out 4-byte integer binary. The y-values of the datapoints are written to a file with the same name as the input file (or xyplot, if input was from standard input) with a .out extension. This is of course only useful for equidistant data. |
| z | Zoom out by 10%. |
| [0-9.-] | Used for entering numbers. |
| Escape | Clear current number. |
| Left | Move left by half a screen. |
| Right | Move right by half a screen. |
| MouseLeftdrag | Expand. A rectangle dragged with the left mouse button is expanded. Normally one presses the button on the lower left corner and releases it at the upper right corner. Starting and ending in other corners inverts the x- and/or y-axes. Pressing the left button and releasing at in the same position undoes the expansion, that is: the axes are fitted to the extremes of the data. |
| MouseMiddleDrag | Track position and integrate. Dragging the mouse with the middle button pressed shows the current x,y position in the upper left corner, followed by the sum of the y-values of the datapoints that are between the initial position and the current position. |
Examples
xyplot -o 1024 file             # wordlength 4, offset 1024 bytes
xyplot -o 1k   file             # wordlength 4, offset 1024 bytes
xyplot -o 1K   file             # wordlength 4, offset 1024 words = 4096 bytes
xyplot -w 2 -n 33 -o 10D        # wordlength 2, display only 33 words,
                                # offset 10*33*2=660 bytes
xyplot -w 2 -n 33 -o 11D        # look at the next chop of 33 words
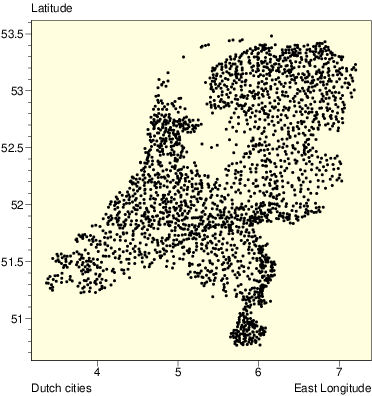
The SIMPLOT distribution contains a data file xy containing the
coordinates and names of all Dutch cities and villages. You can display these by
running xyplot:
xyplot xy    # displays a dot for each entry
xyplot -m xy # displays the name for each entry
The first of the two shows this picture: