plaxes
plots x- and/or y-axes and scales the user units
| parameter | type | units | description |
|---|---|---|---|
| xleft,ybot | float | uu | value at the left/low end of the axes |
| xright,ytop | float | uu | value at the right/high end of the axes |
| xlen,ylen | float | mm | lengths of the axes |
| xtext,ytext | char* | -- | strings plotted at the right/upper end of the axes |
| text | char* | -- | string plotted at the left end of the x-axis |
| returns: | void |
Description
plaxes plots x- and y-axes and sets scale factors and user origin The placement of axes and numbers along the axes is governed by global variables set by plset (T=TRUE, F=FALSE):| global | default | value | description \b |
| X/YIN | F/F | T | number at the right/above of the x/y axis |
| F | at the left/under | ||
| X/YSQUAR | T/F | T | number square to the x/y-axis |
| F | number in the direction of the x/y-axis | ||
| X/YANGLE | 0/90 | val | directions of the axes relative to the initial x-axis; any angle is permitted |
| CROSS | F | T | axes cross at user unit set by X/YCROSS |
| F | axes cross at xleft,ybot | ||
| X/YCROSS | xleft/ybot | val | y/x axis crosses the x/y axis at val user units if CROSS has been set to a non-zero value |
| X/YMARK | 0/0 | val | x/y axis scale marks are placed every val user units |
| 0 | x/y axis scale marks are placed automatically | ||
| X/YSKIP | 0 | val | x/y axis numbers are placed at every val scale mark |
| 0 | x/y axis numbers are placed automatically | ||
| X/YGRID | F | T | grid lines at plotted through the numbered scale marks of the y/x axis |
| F | no grid lines are plotted |
Bugs
Plaxes plots in GXcopy mode, even if the user has set another mode.Examples
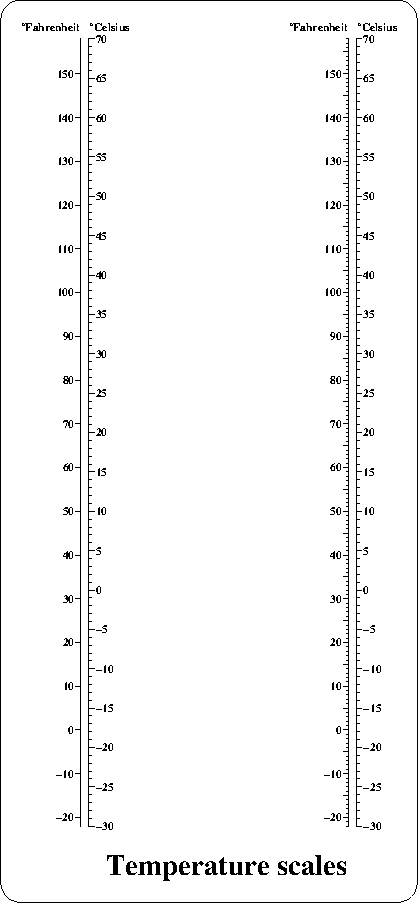
several features: plotting of a single axis by setting xl=0 or xleft=xright, plotting of scale ticks and number to the left or to the right of the axis, and the usage of YMARK:
#include <simplot.h>
#include <stdio.h>
int main() {
   int i,Fmin=-22,Fmax=158,Cmin=-30,Cmax=70;

   plinit(PS,"",A4,50,50,"TB","");

   for (i=0;i<=66;i+=66) {
      plmvorgm(i,0);
      // note that we need tricks to put the Celsius and the Fahrenheit
      // on the correct side. Celsius is put above the Fahrenheit axis
      // and vice versa, and spaces are used for shifting

      plaxes(0,Fmin,0,Fmax,0,200,"","   #0#Celsius","");
      // plots vertical scale; x-axis not used
      plset(YIN,TRUE);
      // numbers will be plotted "inside", that is: right of y-axis
      plmvorgm(2,0);
      // moves origin 2 mm to the right
      plaxes(0,Cmin,0,Cmax,0,200," ","#0#Fahrenheit   "," ");
      // plots celsius scale 2 mm right of fahrenheit scale
      plset(YIN,FALSE);
      // resets plotting 'outside' that is: left of y-axis
      plset(YMARK,TRUE);
      // causes plotting of scale marks at each degree
   }
   plset(HEIGHT,5);
   plotm(-33,-10,UP);
   plformat(0,0,"Temperature scales");
   plframe(5,5);
   exit(0);
}