plhist
plot histogram or stick plot
| parameter | type | units | description |
|---|---|---|---|
| *x,*y | float* | uu | arrays defining the histogram |
| n | int | -- | number of elements in the arrays |
| type | int | -- | histogram type: BARS, ENVELOPE or STICKS |
| baseline | int | -- | if TRUE, a baseline is drawn |
| ybase | float | uu | y-position of the baseline, if any |
| returns: | void |
Description
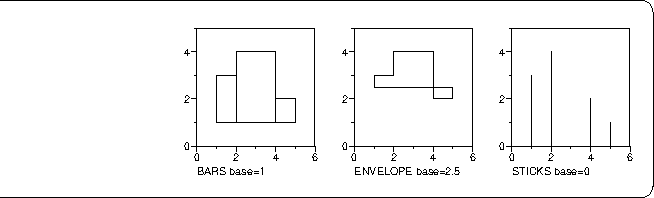
plhist plots a histogram using values in arrays x (position) and y (height). x must be in ascending order. If baseline is TRUE a baseline is drawn at y=ybase. type determines the histogram type and can have one of three predefined values: BARS, ENVELOPE and STICKS. See the example for further explanation.Examples
n=4 plrdx n 1 2 4 5 plrdy n 3 4 2 1

plinit PS plhist  A4 50 50 "" ""
plaxes 0 0 6 5 30 30 "" "" "BARS base=1"
plrect 0 0 6 5
       plhist n BARS TRUE 1   plmvorg 8 0
plaxes 0 0 6 5 30 30 "" "" "ENVELOPE base=2.5"
plrect 0 0 6 5
       plhist n ENVELOPE TRUE 2.5 plmvorg 8 0
plaxes 0 0 6 5 30 30 "" "" "STICKS base=0"
plrect 0 0 6 5
       plhist n STICKS TRUE 0
plframe 5 3