plpoly
calculate and plot a polynomial through a set of points
| parameter | type | units | description |
|---|---|---|---|
| x,y | float* | uu | datapoints |
| n | int | -- | number of datapoints |
| k | int | -- | degree of the polynomial |
| xmin,xmax | float | uu | plotrange |
| linetype | int | -- | format of the line drawn |
| returns: | void |
Description
plpoly fits a polynomial of degree k through n points stored in the arrays x and y, and then plots it between xmin and xmax. If the NULL pointer is given instead of x or y, the values 0..n-1 are used instead. After executing it, the function plpolv may be used to get the value of the polynomial in any x-position, or the function plpolc may be used to find the coefficients.See also
plpolf, plpolc, plpolv G.E.Forsythe, "Generation and use of orthogonal polynomials for data-fitting with a digital computer" SIAM Journal on Numerical Analysis vol 5, page 74Examples
n=4 xmin=1991 xmax=1992.1 ymin=0 ymax=2500
plinit PS plpoly A4 50 50 "" ""
plrdx n 1991 1991.5 1992 1992.1
plrdy n 800 700 1600 2200
plaxes xmin ymin xmax ymax 100 70 "" "" ""
plpline n X DOWN
plframe 5 3
plclip xmin ymin xmax ymax
plpoly n 2 xmin xmax DOWN
plpolc
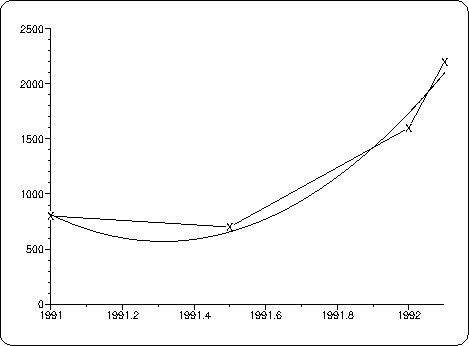
| exp | coeff |
| 0 | 9801916765.45 |
| 1 | -9844674.11426 |
| 2 | 2471.90463773 |