plpie
plot a simple pie diagram
| parameter | type | units | description |
|---|---|---|---|
| values | float* | any | relative sizes of the segments |
| n | int | number of segments to be plotted | |
| labels | char** | array of 16-character strings, for labelling the segments | |
| r | float | uu | pie radius |
| x,y | float | uu | position of the center of the pie |
| toptext | char* | text to be plotted on top of the pie | |
| topfac | float | enlargement factor for the top text symbol size | |
| bottext | char* | text to be plotted under the pie | |
| botfac | float | enlargement factor for the bottom text symbol size | |
| returns: | void |
Description
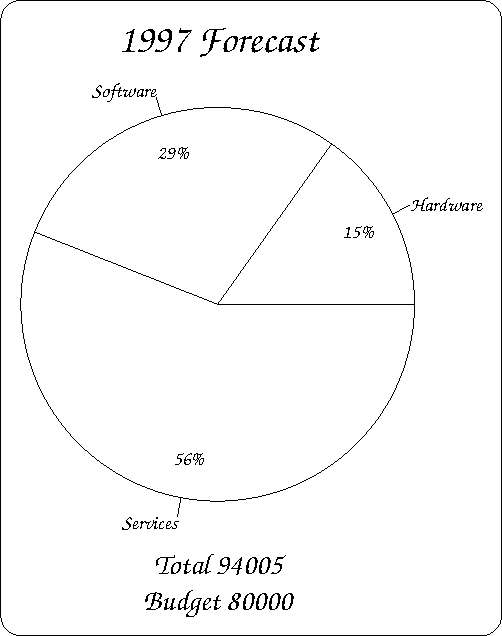
plpie plots a pie showing the relative contributions of values in values to their total. The segments are labeled with string of up to 16 characters stored in labels and two texts of variable size are placed over and under the pie. Usage in a simplot script needs a special treatment for the segment labels: these are not read like other arrays, but exactly n strings must be placed between the arguments n and r.Examples
plinit PS plpie A4 0 0 ZCMI ""
n=3 plrdx n 123 234 454
plset HEIGHT 3
plpie n
      Hardware Software Services
      50
      100 100
      "1997 Forecast" 2
      "Total 94005\nBudget 80000" 1.5
plframe 5 5