pltrace
traces an (implicit) 2-dimensional function
| parameter | type | units | description |
|---|---|---|---|
| ident | char* | -- | marker to be plotted with the curve |
| func(float,float) | float* | uu | function of x and y to be traced |
| xmin,ymin,xmax,ymax | float | uu | in this window |
| resol | float | % | resolution relative to visible field, default 0 = 1% |
| grid | float | % | search grid's line distance relative to visible field, default 0 = 1% |
| linetype | int | -- | see plot |
| returns: | void |
Description
pltrace traces a function in the rectangle xmin,ymin,xmax,ymax. For example: func(x,y) = x2 + y2 - 25 plots a circle with a radius of 5 user units and the centre at the origin. But, of course, pltrace is not the most efficient method for plotting a circle. resol is the resolution of the plot in mm, that is: the curve will be plotted in steps of resol mm long. It can not be set to less than 0.05 mm. grid is the line-distance of an imaginary grid placed over the plotting area. It is used for searching starting points of (sub)curves. If a (sub)curve happens to lie completely within a ``pixel'' of the grid, then it will not be found.Examples
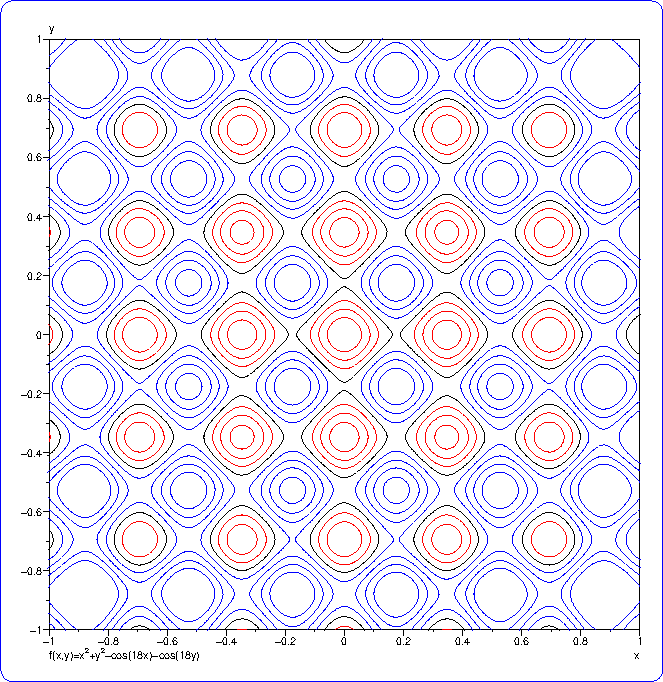
The program pltrace1.c plots the function f(x,y)=x2+y2-cos(18x)-cos(18y) By adjusting FIRST, LAST and STEP you can easily adapt it to plot other cross-sections above and below the plane of the paper.
// pltrace1 - traces contours of the function:
// f(x,y)=x2+y2-cos(18x)-cos(18y)

#include <stdlib.h>
#include <math.h>
#include <simplot.h>
#define RESOL .3
#define GRID 2
#define FIRST -2
#define LAST 2
#define STEP .5
float z;

float func(float x,float y) {
   float r = x*x+y*y-cos(18*x)-cos(18*y)-z;
   return r;
}

int main() {
   extern float func(float,float);

   plinit(PS,"pltrace1",A4,30,30,"","");
   plaxes(-1,-1,1,1,150,150,"x","y",
          "f(x,y)=x2^+y2^-cos(18x)-cos(18y)");
   plrect(-1,-1,1,1);
   for (z=FIRST;z<=LAST;z+=STEP) {
      if (z<-0.1)
         plcolor(Red);
      else
         if (z>0.1)
            plcolor(Blue);
         else
            plcolor(Black);
      pltrace("",func,-1,-1,1,1,RESOL,GRID,DOWN);
   }
   plframe(5,3);
   exit(0);
}
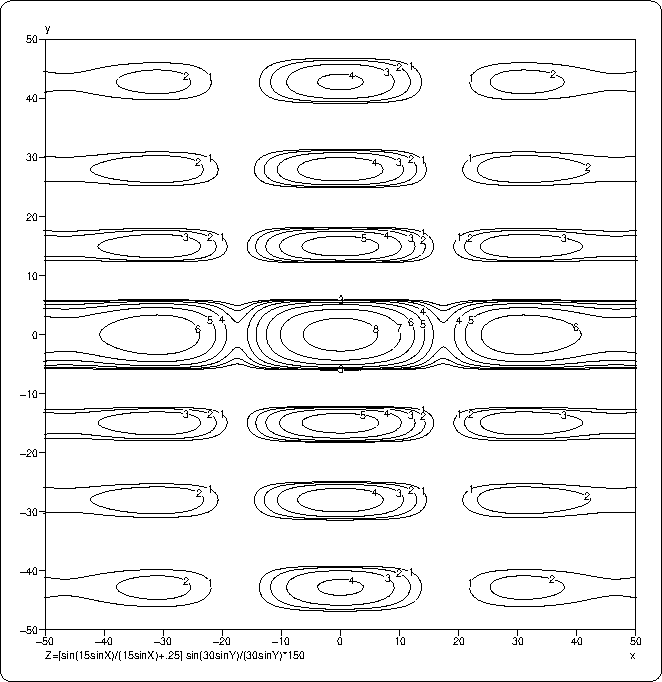
// pltrace2 - traces contours of the function:

//      sin(15*sin(x))          sin(30*sin(y))
//     (-------------- + .25) * -------------- * 150
//          15*sin(x)               30*sin(y)

#include <string.h>
#include <stdlib.h>
#include <math.h>
#include <simplot.h>
#define XMIN -50
#define YMIN -50
#define XMAX +50
#define YMAX +50
#define XL   150
#define YL   150
#define RESOL .3
#define GRID   2
float z;

float efsin(float xx,float yy) {
   float x,y;
   x = 15*sin(xx*M_PI/180);
   if (fabs(x)<.1)
      x = .1;
   y = 30*sin(yy*M_PI/180);
   if (fabs(y)<.1)
      y = .1;
   return (sin(x)/x+.25)*sin(y)/y*150-z;
}

int main() {
   char ident[2]=" ";
   extern float efsin(float,float);
   int i;

   plinit(PS,"pltrace2",A4,30,30,"","");
   plaxes(XMIN,YMIN,XMAX,YMAX,XL,YL,"x","y",
          "Z=[sin(15sinX)/(15sinX)+.25] sin(30sinY)/(30sinY)*150");
   plrect(XMIN,YMIN,XMAX,YMAX);
   plset(OPAQUETEXT,TRUE);
   for (i=0,z=1;i<=8;i++) {
      ident[0]=i+'1';
      pltrace(ident,efsin,XMIN,YMIN,XMAX,YMAX,RESOL,GRID,DOWN);
      z *= 2;
   }
   plframe(5,3);
   plend();
   exit(0);
}
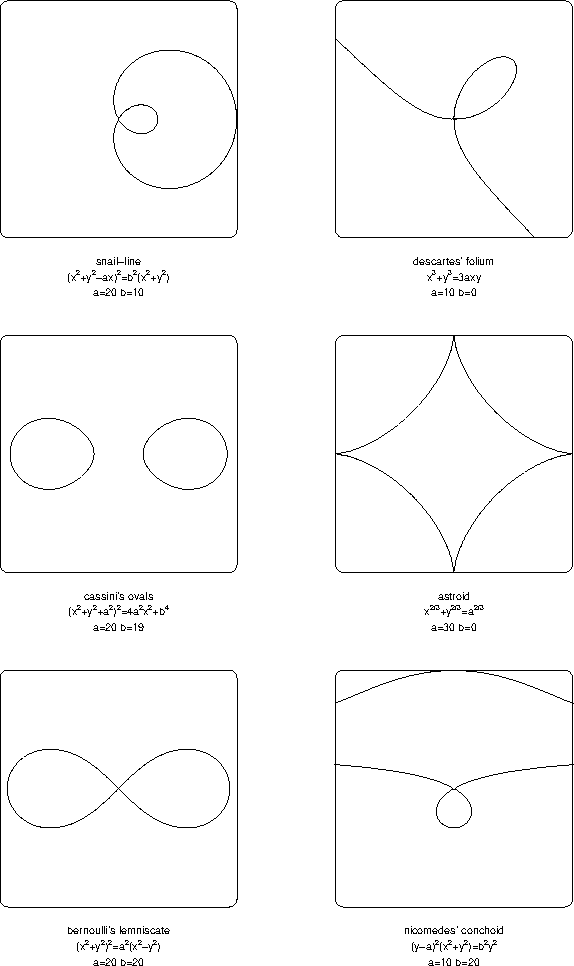
//  __________ pltrace3 __________
// plotting functions with pltrace
// each curve is placed in a separate square frame
// features: distribution of plots over the plot-page with plreserv
//           use of plframe and plclip

float a,b,asq,bsq;
#include <values.h>
#include <string.h>
#include <simplot.h>
#include <math.h>
#define S(x) ((x)*(x))

float snail (float x,float y) {
   return S(x*x+y*y-a*x)-bsq*(x*x+y*y);
}
float cassin(float x,float y) {
   return S(x*x+y*y+asq)-4*asq*x*x-bsq*bsq;
}
float folium(float x,float y) {
   return x*x*x+y*y*y-3*a*x*y;
}
float astrid(float x,float y) {
   return pow((x*x),.333333)+pow((y*y),.333333)-pow((a*a),.333333);
}
float concho(float x,float y) {
   return S(y-a) * (x*x+y*y)-bsq*y*y;
}
float sinus (float x,float y) {
   return y-a*sin(b*x);
}

void curve(float (*func)(float,float),float p,float q,char *name,char *form) {
   a=p;
   b=q;
   asq=a*a;
   bsq=b*b;
   plframe(-1,0);
   plreserv(55,50,85);
   plu(0,0);
   pld(0,0);
   plframe(30,2);           //box around origin
   plu(0,-35);
   plformat(0,-.5,"%s\n%s\na=%g b=%g",name,form,a,b);
   pltrace("",func,-30,-30,30,30,0,0,DOWN);
}

int main() {
   plinit(PS,"pltrace3",A4,0,0,"","");
   plclip(0,20,185,277);

   // plot several frames (r*r cm) and a curve in it

   curve(snail ,20,10  ,"snail-line",            "(x2^+y2^-ax)2^=b2^(x2^+y2^)");
   curve(cassin,20,19  ,"cassini's ovals",       "(x2^+y2^+a2^)2^=4a2^x2^+b4^");
   curve(cassin,20,20  ,"bernoulli's lemniscate","(x2^+y2^)2^=a2^(x2^-y2^)");
   curve(folium,10, 0  ,"descartes' folium",     "x3^+y3^=3axy");
   curve(astrid,30, 0  ,"astroid",               "x2/3^+y2/3^=a2/3^");
   curve(concho,10,20  ,"nicomedes' conchoid",   "(y-a)2^(x2^+y2^)=b2^y2^");
   exit(0);
}