plhiss
plot shaded histogram
| parameter | type | units | description |
|---|---|---|---|
| x,y | float* | uu | arrays defining the histogram |
| n | int | -- | number of elements in the arrays |
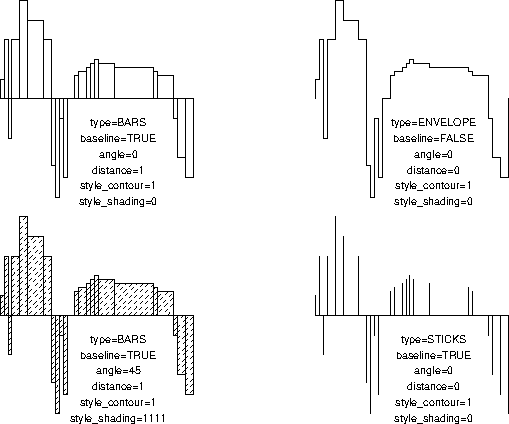
| type | int | -- | histogram type: BARS, ENVELOPE or STICKS |
| baseline | int | -- | if TRUE, a baseline is drawn |
| ybase | float | uu | y-position of the baseline, if any |
| style_contour | int | -- | line style for the histogram contours |
| angle | float | degr | angle for hatching |
| distance | float | mm | distance between hatching lines |
| style_shade | int | -- | line style for hatching lines |
| returns: | void |
Description
plhiss plots a histogram using values in arrays x (position) and y (height+ybase). x must be in ascending order. If baseline is TRUE a baseline is drawn at y=ybase. type determines the histogram type and can have one of three predefined values: BARS, ENVELOPE and STICKS. See the example for further explanation. The histogram contours are dashed according to the parameter style_contour the histogram may also be hatched by setting distance to a non-zero value.Examples
#include <simplot.h>
int main() {
   float x[] = { 1, 2, 3, 4, 6, 8,12,14,15,16,17,18,20,
                 21,23,24,25,26,30,40,41,45,46,48,50};
   float y[] = { 5,15,-10,15,25,20,15,-17,-25,-5,-20,0,
                 6,7,8,9,10,9,8,7,6,-5,-15,-20,-25};
   int type[] = {BARS, BARS,  ENVELOPE, STICKS};
   int base[] = {TRUE, TRUE,  FALSE,    TRUE};
   int das[]  = {DOWN, DOWN,  DOWN,     DOWN};
   int ang[]  = {0,    45,    0,        0};
   int dis[]  = {1,    1,     0,        0};
   int sda[]  = {0,    1111,  0,        0};
   char *s[5]={"FALSE","TRUE","STICKS","ENVELOPE","BARS"};
   int i;

   plinit(PS,"plhiss",200,150,0,0,"","");
   for (i=0;i<4;i++) {
      plreserv(30,25,55);
      plhiss(x,y,25,type[i],base[i],0,das[i],ang[i],dis[i],sda[i]);
      plot(31,-5,UP);
      plformat(0,-.5,"type=%s\n"
               "baseline=%s\n"
               "angle=%d\n"
               "distance=%d\n"
               "style__contour=%d\n"
               "style__shading=%d",
               s[type[i]],s[base[i]],ang[i],dis[i],das[i],sda[i]);
   }
   exit(0);
}